
| Version 13 (modified by tanmay, 6 years ago) (diff) |
|---|
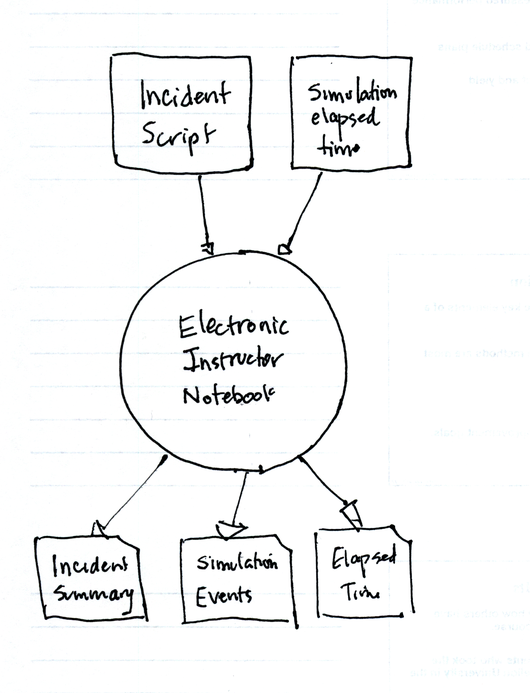
Electronic Instructor Notebook Test Cases
Test Case 1
Purpose
This is a "smoke" test to verify the basic functionality of the application.
Configuration
These tests assume dynamicdata\incident_script.xml is the full incident script.
In a terminal window (from webapps directory) execute: python einotebook/spikes/runTimer.py.
Application Startup
In a terminal window with webapps as the current directory, start the web server with the (Python 2.7) command: python -m CGIHTTPServer 8080
Open a web browser to localhost:8080/einotebook/
Four tabs appear with the first tab active ("Incident Summary"). The page content is a summary description for each of five incidents.
The timer in the upper right hand corner should be advancing according to the runTimer.py script.
The Simulation Script tab shows the list of events in the script with the current event highlighted in yellow.
Wait until the timer elapses to 1:00. Click "Jump to Current Event." The event closest to 1:00 is highlighted.
The Current Event tab shows just the current event.
The Map tab has static maps for two scenarios: practice and full.
Test Case 2
Purpose
Verify that the event elapsed time works correctly. Verify "jump to current event" works correctly.
Configuration
Attached to this page is a test script file: incident_script.xml. Save this file to the dynamicdata directory.
Modify the contents of dynamicdata\sim_elapsedtime.json to read:
{"elapsedtime":"39"}
Application Startup
In a terminal window with webapps as the current directory, start the web server with the (Python 2.7) command: python -m CGIHTTPServer 8080
Close any open web browser windows. Open the web browser and verify that there are no cookies. Browse to localhost:8080/einotebook/
The timer in the upper right hand corner reads 00:00:39.
The Simulation Script tab shows the list of events in the script. The event at time 00:30 is highlighted. The events at time 00:00 and 00:05 are greyed out.
Open the file dynamicdata\sim_elapsedtime.json in a text editor. Change "39" to "46". Observe the einotebook window as you save the data file. Within one second of saving the file the time box displays 00:00:46 and the event at time 00:45 becomes highlighted while the event at time 00:30 is greyed out.
Scroll to the top of the script events. Click "Jump to Current Event". The display advances to the event at time 00:45 and it is highlighted. Slowly scroll upwards to view the previous events; they are all greyed out.
Test Case 3
Purpose
Verify all details of the Incident Summary page appear: Start time, title, incident number, and description.
Configuration
These tests assume dynamicdata\incident_script.xml is the full incident script.
In a terminal window (from webapps directory) execute: python einotebook/spikes/runTimer.py.
Application Startup
In a terminal window with webapps as the current directory, start the web server with the (Python 2.7) command: python -m CGIHTTPServer 8080
Open a web browser to localhost:8080/einotebook/
Four tabs appear with the first tab active ("Incident Summary").
The page content is a summary description for each of five incidents.
The start time appears in this format on the left side in the header of each incident, for example for the first incident - "Time: 00:00:00".
The incident number appears on the center in the header of each incident, for example for the first incident - "187". Moreover, each type of incident has a unique incident number.
The title appears on the right side in the header of each incident, for example for the first incident - "Stalled DOT/Traffic Collision"
The description appears below each header of each incident, for example for the first incident - "This is a stalled DOT truck on SB 55 overpass.....".
Test Case 4
Purpose
Verify Current Event tab will display multiple events that happen at the same time. Verify the contents changes automatically when a new event happens.
Configuration
Attached to this page is a test script file: incident_multiple.xml. Save this file to the dynamicdata directory and rename the file to incident_script.xml.
In a terminal window (from webapps directory) execute: python einotebook/spikes/runTimer.py.
Application Startup
In a terminal window with webapps as the current directory, start the web server with the (Python 2.7) command: python -m CGIHTTPServer 8080
Open a web browser to localhost:8080/einotebook/
Four tabs appear with the first tab active ("Incident Summary"). Click on the "Current Event" tab.
The Current Event tab shows just the current event. A single event at time "00:00:00" with incident number "181" is displayed.
Wait until the timer elapses to "00:00:30". Three events with incident numbers 181, 188 and 187 respectively appear with time for all at "00:00:30".
Wait until the timer elapses to "00:00:45". A single event at time "00:00:45" with incident number "181" is displayed.
Test Case 5
Purpose
Verify Simulation Script tab shows all event types with proper formatting: bold for event type, Italics for field names, correct indenting for field data. Verify proper function at boundary conditions: start and end of script.
Configuration
Attached to this page is a test script file: incident_multiple.xml. Save this file to the dynamicdata directory and rename the file to incident_script.xml.
In a terminal window (from webapps directory) execute: python einotebook/spikes/runTimer.py.
Application Startup
In a terminal window with webapps as the current directory, start the web server with the (Python 2.7) command: python -m CGIHTTPServer 8080
Open a web browser to localhost:8080/einotebook/
Four tabs appear with the first tab active ("Incident Summary"). Click on the "Simulation Script" tab.
Every incident has its respective color, i.e, nothing is greyed out. The first event at time "00:00:00" with incident number "181" is highlighted.
For each incident, each event has a header in bold and aligned to the left, for example, for the first incident, the event names "Incident Start", "MAINTENANCE_RADIO" and "TELEPHONE CONVERSATION Evaluation"in rp
Tests..
Verify correct maps are shown on Map page with incident markers in correct locations.
Verify colors are correctly assigned to incidents. Verify color pallette "wraps around" if there are more incidents than colors in the palette.
Attachments
-
einotebook_context_diagram.png
 (213.1 KB) -
added by jdalbey 7 years ago.
(213.1 KB) -
added by jdalbey 7 years ago.
-
incident_script.xml
(9.0 KB) -
added by jdalbey 7 years ago.
System Test Script with two incidents
-
incident_multiple.xml
(10.6 KB) -
added by tanmay 6 years ago.
Multiple incidents at same time test file
-
incident_colors.xml
(14.0 KB) -
added by tanmay 6 years ago.